“How Modulos Solves It” — 7 candidate redesigns
The current alternating screenshot-and-text rows feel dated. Below are seven candidate replacements — codex's top 5 plus the user-requested bento, plus codex's missing traceability-map idea. All use the same sample data (Risk pillar capabilities + real product screenshots) so you can compare like-for-like. Pick one to ship.
“The real defect isn't the zig-zag layout. It's that each capability is presented as an isolated brochure tile. For Modulos, the persuasive thing is the system: how evidence supports controls, controls satisfy frameworks, risks connect to mitigations, agents assist but humans approve, outputs become audit-ready.”
V1 · #7 Tabs + multi-pane workspace
Codex pick #1 · best balanceVertical tab strip + a dense workspace pane per capability (chart + supporting table + framework chips). Feels like the product itself. Supports 5–7 capabilities without scroll-fatigue.
LCP: Risky if hydrated above the fold. Mitigation: render initial pane server-side; lazy hydrate.
Quantify Risk in Monetary Terms
Express AI risk exposure in monetary terms. Choose the method that matches your maturity — from risk matrices and scenario analysis to Monte Carlo simulation with VaR/CVaR output.
- Method
- Monte Carlo · 10,000 runs
- VaR 95%
- €82,170
- CVaR 95%
- €118,400
- Confidence
- σ = 12% of mean
V2 · #4 Spec-sheet / data sheet
Codex pick #2 · most underused; safestBloomberg terminal vibe. Capability × Output × Method × Frameworks as a tight table with expand-on-click rows. Maximum text density, SEO-friendly.
LCP: Safest of all variants — no images, no charts, no client JS beyond row expansion.
V3 · #5 Interactive demo strip
Codex pick #3 · use selectivelyThree live mini-widgets: Monte Carlo iteration slider, risk appetite slider, framework toggle. Visitor manipulates the platform in place. "Show, don't tell" taken literally.
LCP: Client JS required for interactivity. Mitigation: place below the fold; tree-shake.
Quantify Risk in € · live
Drag the slider to see how Monte Carlo iterations sharpen the VaR/CVaR estimate.
Risk Appetite · live
Drag to set the limit. Current exposure is €48K; overages auto-flag.
One control, many frameworks · live
Click a framework to see which controls satisfy it.
- Risk Assessment Process
- Bias & Fairness Testing
- HITL Override
V4 · #9 Annotated screenshot zooms
Codex pick #4 · makes screenshots earn their pixelsOne large risk dashboard screenshot with clickable hotspots; each click highlights a region with a description card. Reuses real product screenshots.
LCP: Image is the LCP candidate. Mitigation: pre-optimized WebP picture, priority + fetchPriority.
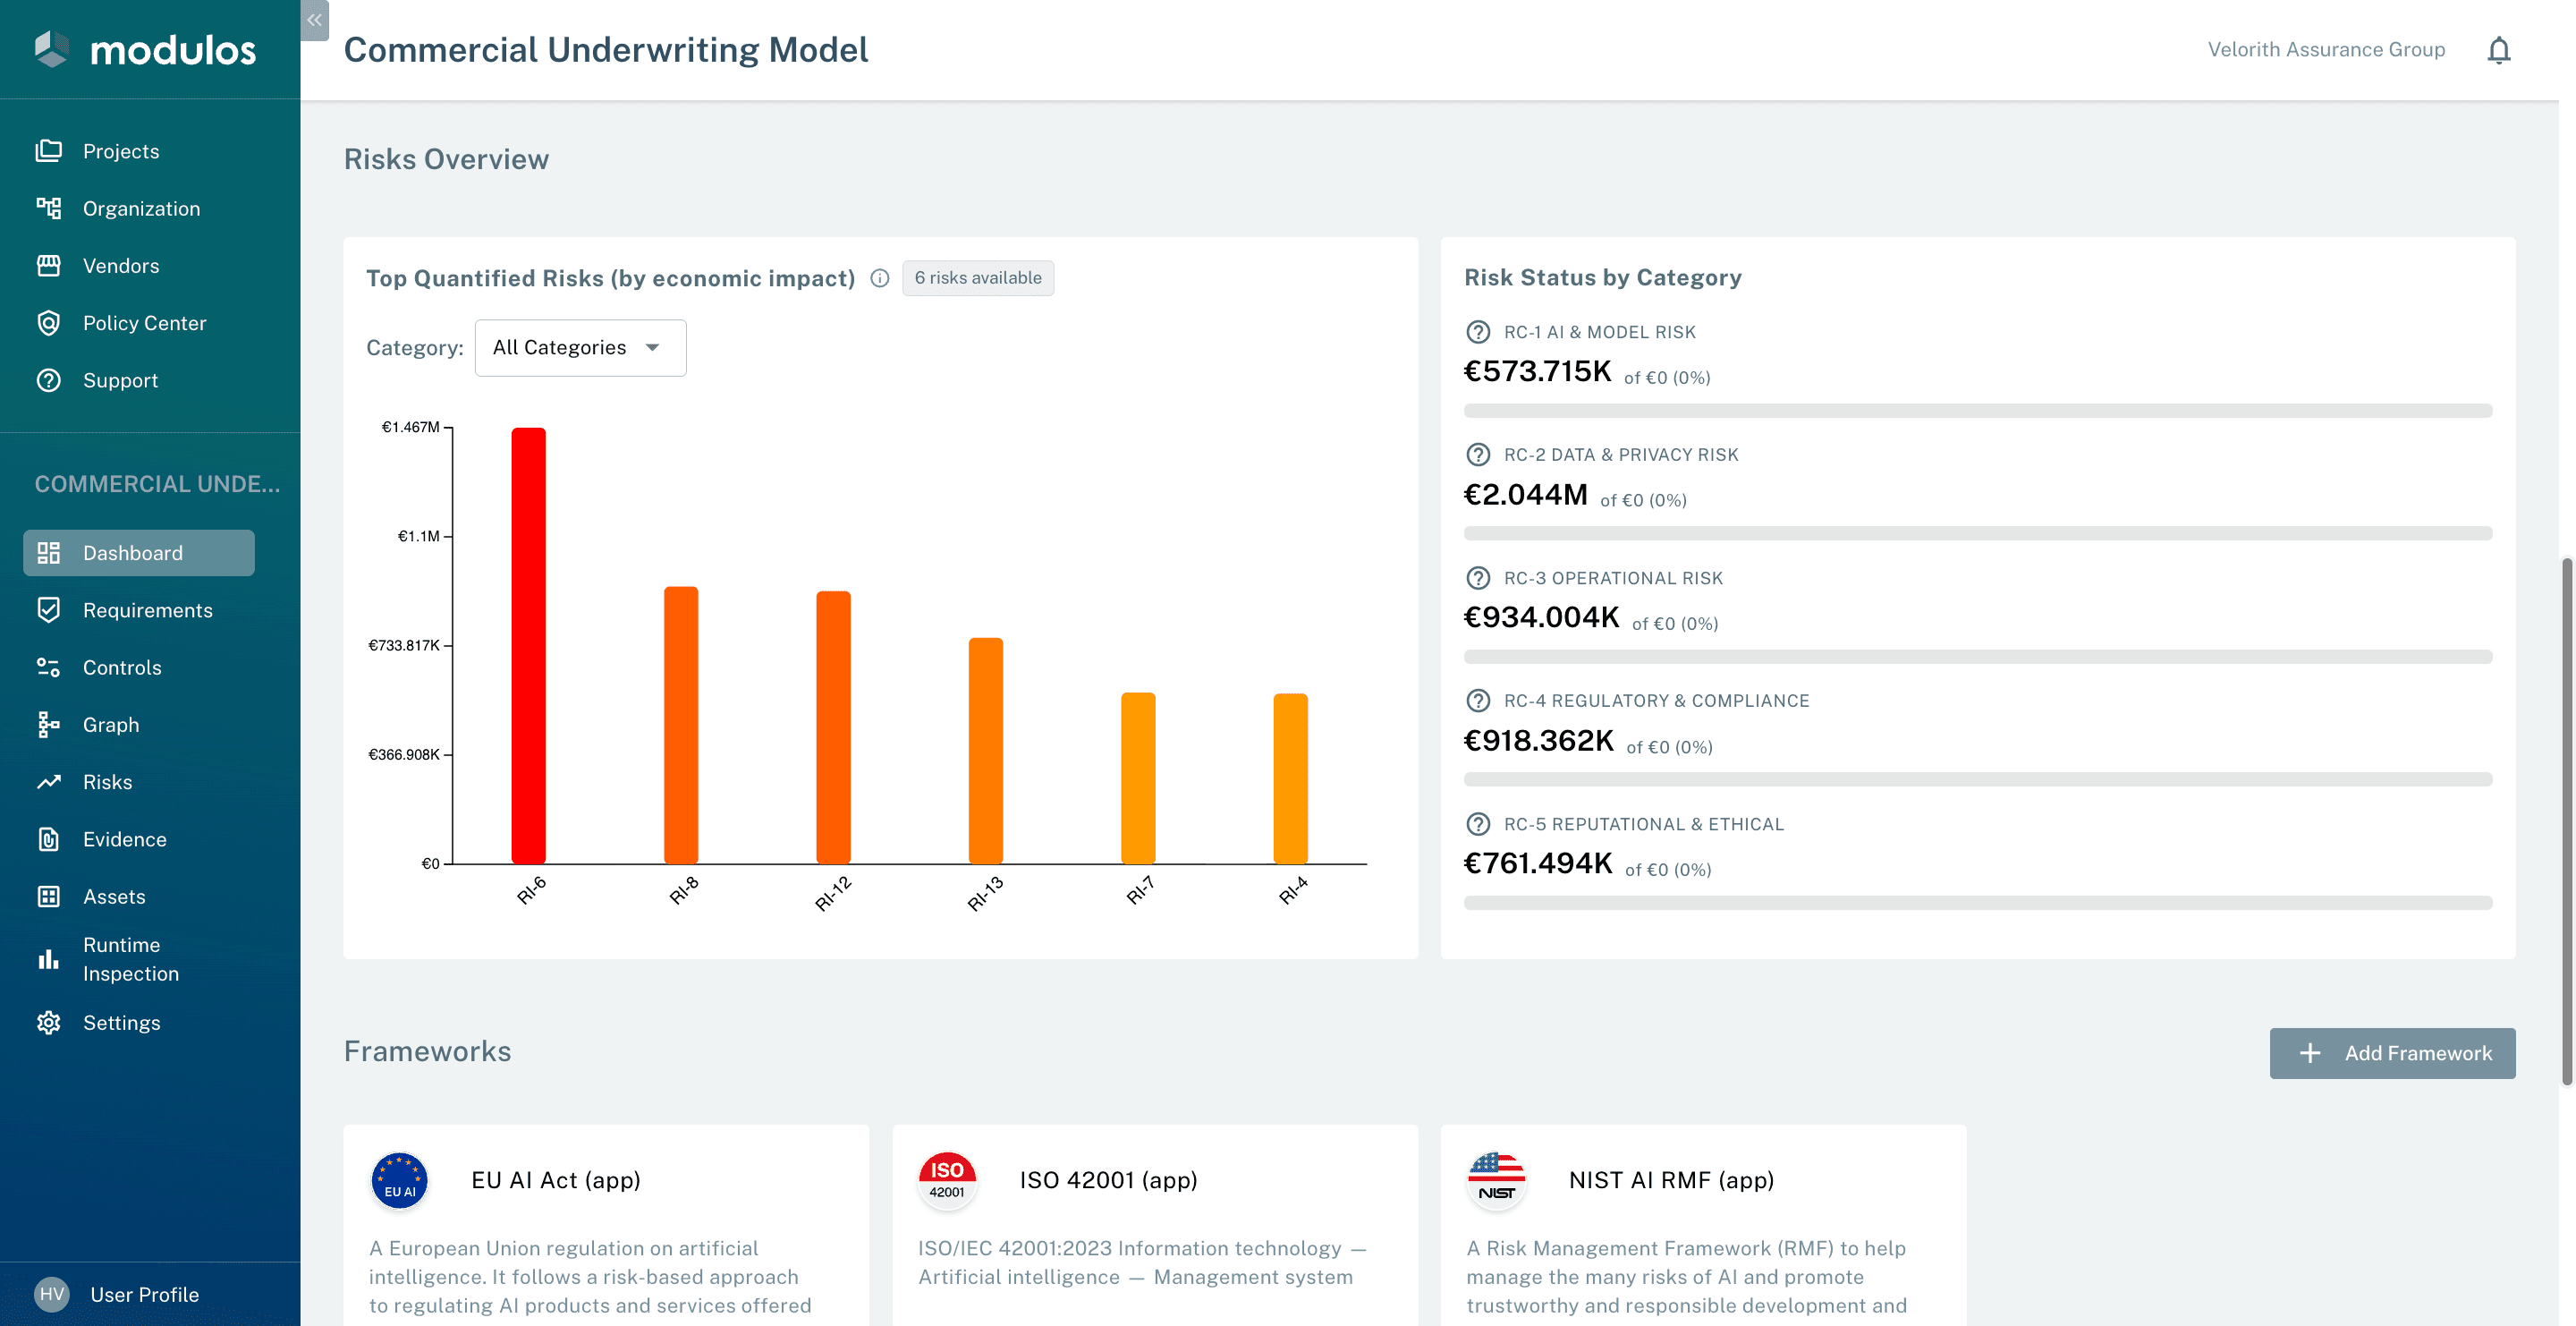
Top quantified risks
Each risk scored in monetary terms. Bar height = € impact. Click for the full distribution and method.
V5 · #1 Sticky-scroll storytelling
Codex pick #5 · premium narrativeLeft column scrolls through capabilities; right column is sticky and morphs as you scroll past each section. Documentary, not brochure.
LCP: Highest LCP risk. Mitigation: render first section server-side; observer-driven swap.
Quantify Risk in Monetary Terms
Express AI risk exposure in monetary terms. Choose the method that matches your maturity — from risk matrices and scenario analysis to Monte Carlo simulation with VaR/CVaR output.
Risk Value Over Time
Track how risk exposure evolves at project and organization level. See current value, 7-day change, and utilization against your risk limits — with trend lines, moving averages, and threshold alerts.
Risk Appetite & Limits
Define organization-wide risk tolerance. Set category limits. Automatically flag when projects exceed their allocated risk budget.
Risk & Threat Vector Tracking
Track risk and threat vectors to your AI system and quantify their impact. Each vector links to its mitigating controls and supporting evidence.
Organization Risk Taxonomy
Define your own risk categories and scoring criteria. Once set, risks become comparable across all AI projects in your portfolio.
V6 · #3 Asymmetric bento grid
User added · safe fallbackOne large hero card + four smaller mosaic cards, each with a real micro-visual (bars, sparkline, ring, constellation, taxonomy tree). Apple iPhone / Linear / Notion AI aesthetic.
LCP: Server-renderable; all charts are inline SVG. Safe.
Quantify Risk in Monetary Terms
Express AI risk exposure in monetary terms. Choose the method that matches your maturity — from risk matrices and scenario analysis to Monte Carlo simulation with VaR/CVaR output.
Risk Value Over Time
Trend lines, moving averages, threshold alerts
Risk Appetite & Limits
Org-wide tolerance with automatic overage flags
Risk & Threat Vector Tracking
Organization Risk Taxonomy
V7 · #11 Traceability map (codex's missing idea)
Codex added · most differentiatedOne dense visual showing the platform as a connected workflow: frameworks → requirements → controls ↔ risks ↔ evidence ← agents → audit exports. Hover/click traces the full chain. Distinctively Modulos — addresses the core diagnosis that the current section presents capabilities as isolated brochure tiles.
LCP: Server-renderable SVG + lazy interactivity.
Every capability connects.
Frameworks generate requirements. Requirements are satisfied by reusable controls. Controls consume evidence and mitigate risks. Agents author evidence; humans approve. Everything rolls up to audit-ready exports. Hover or click any node to trace its full chain.